House-Sales
Interactive house sales dashboard
Developing an immersive Tableau dashboard for real-time interactive visualization of house sales data, providing dynamic insights and trends for informed decision-making in the real estate market.
Client
RV College of Engineering
Services
Data Visualisation
Industries
Real Estate
Date
August 2022
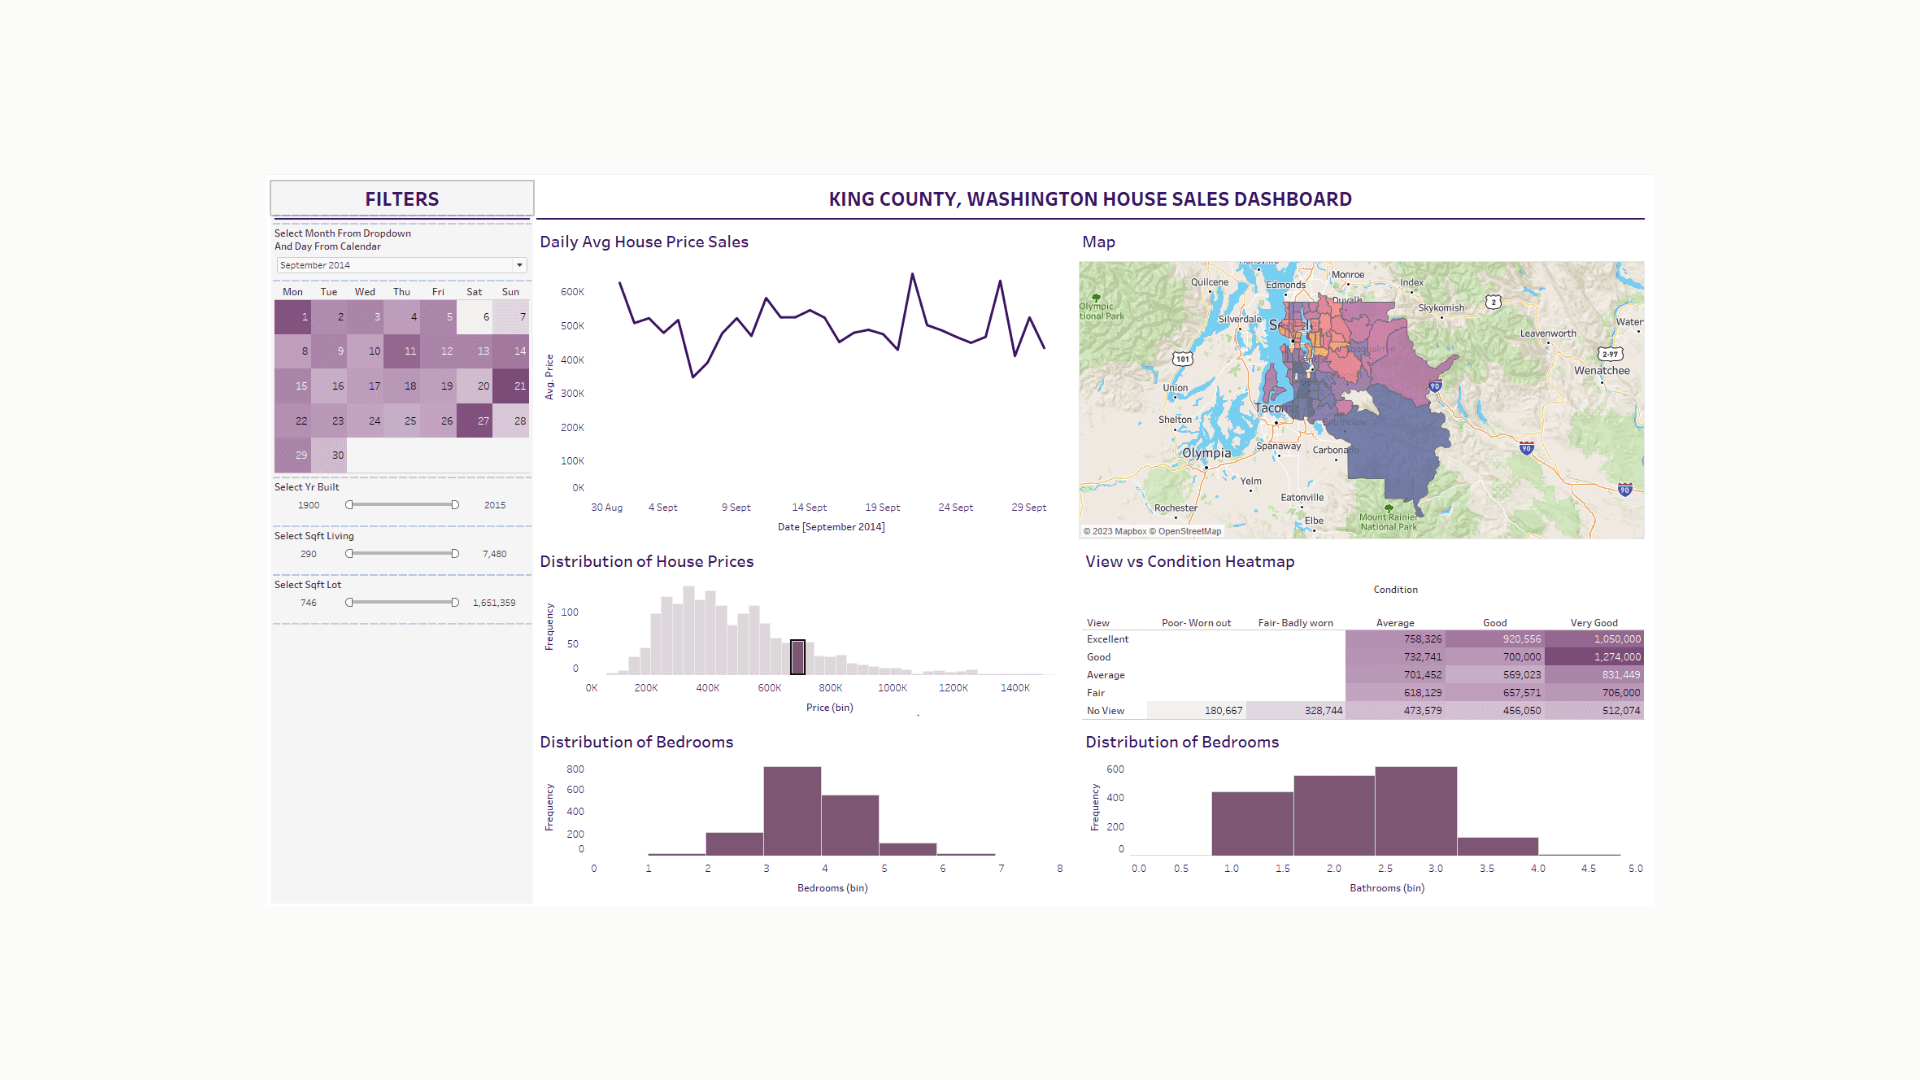
I began by exploring real estate data sources, understanding key metrics influencing house sales. I delved into Tableau's capabilities, leveraging online tutorials and documentation to acquire the necessary skills for creating dynamic visualizations. Studying industry trends and user preferences informed the choice of specific charts, ensuring relevance and clarity in presenting the data.
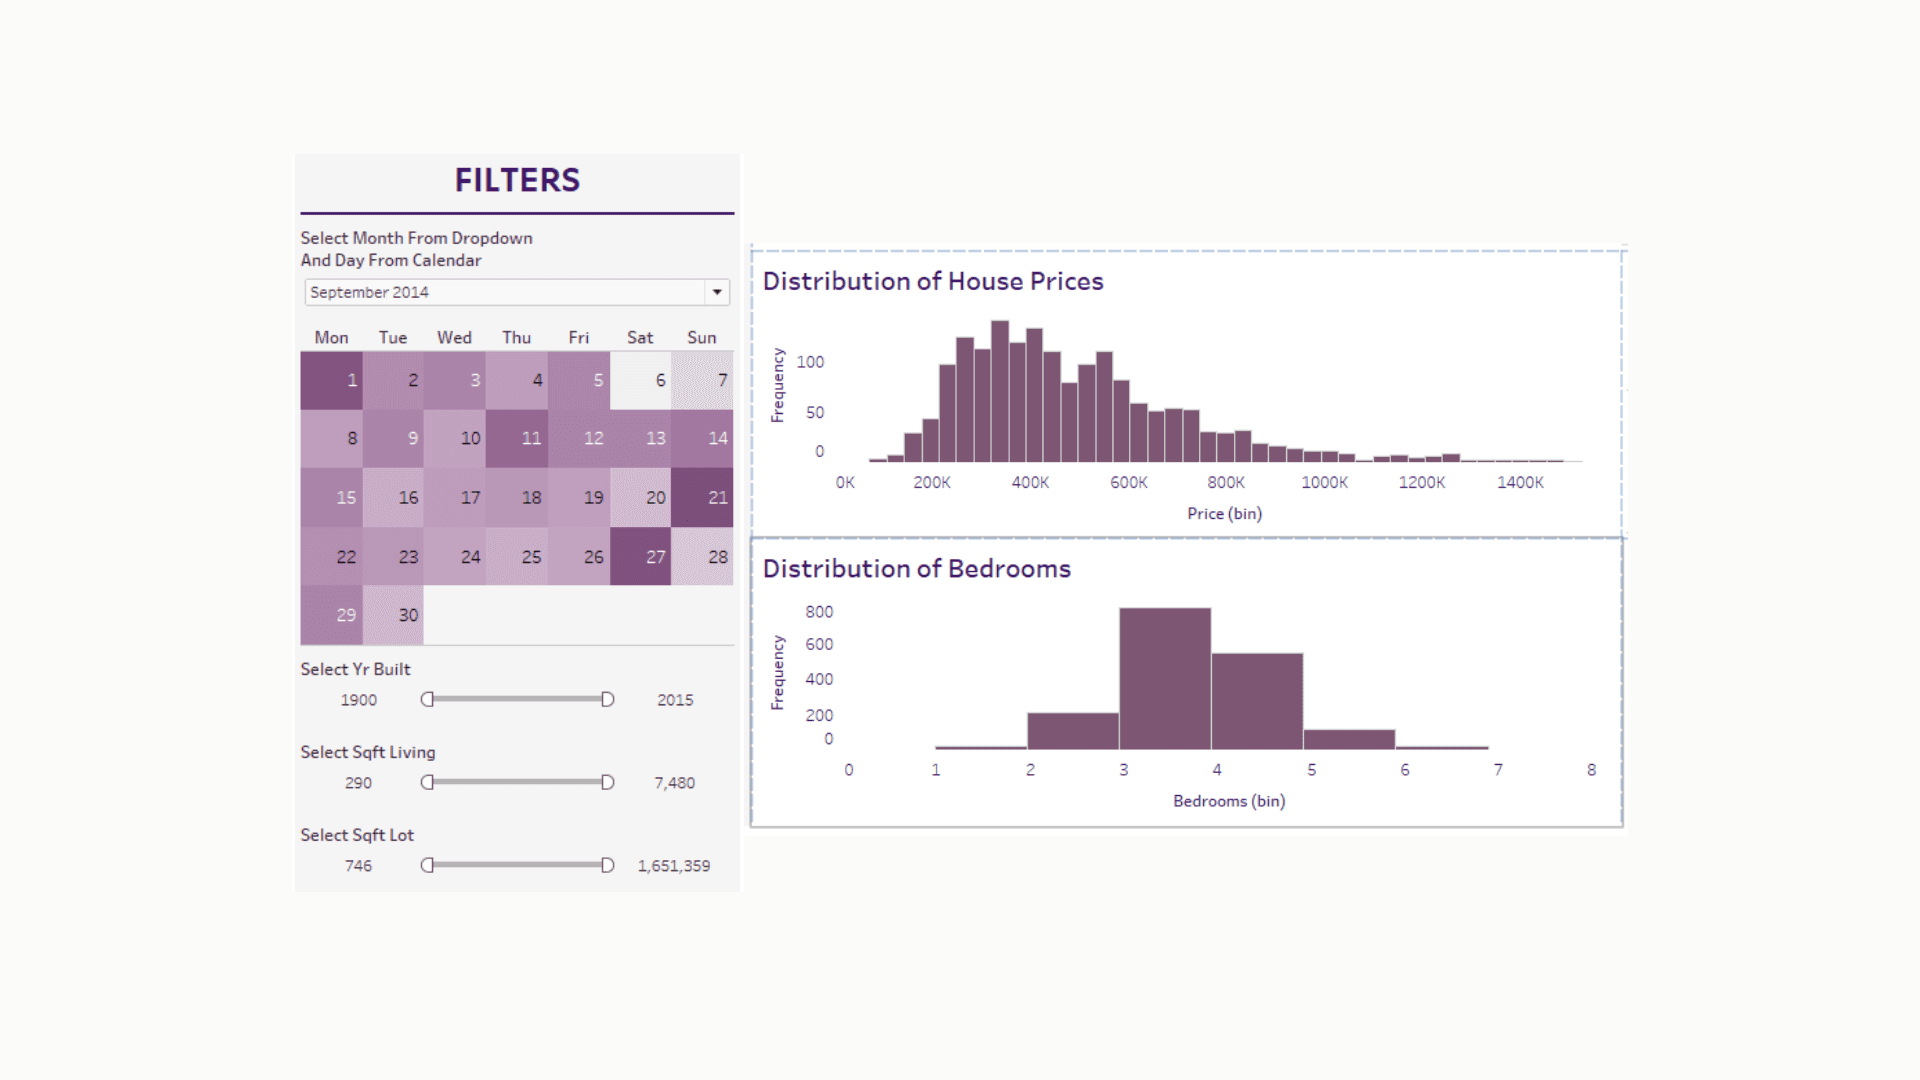

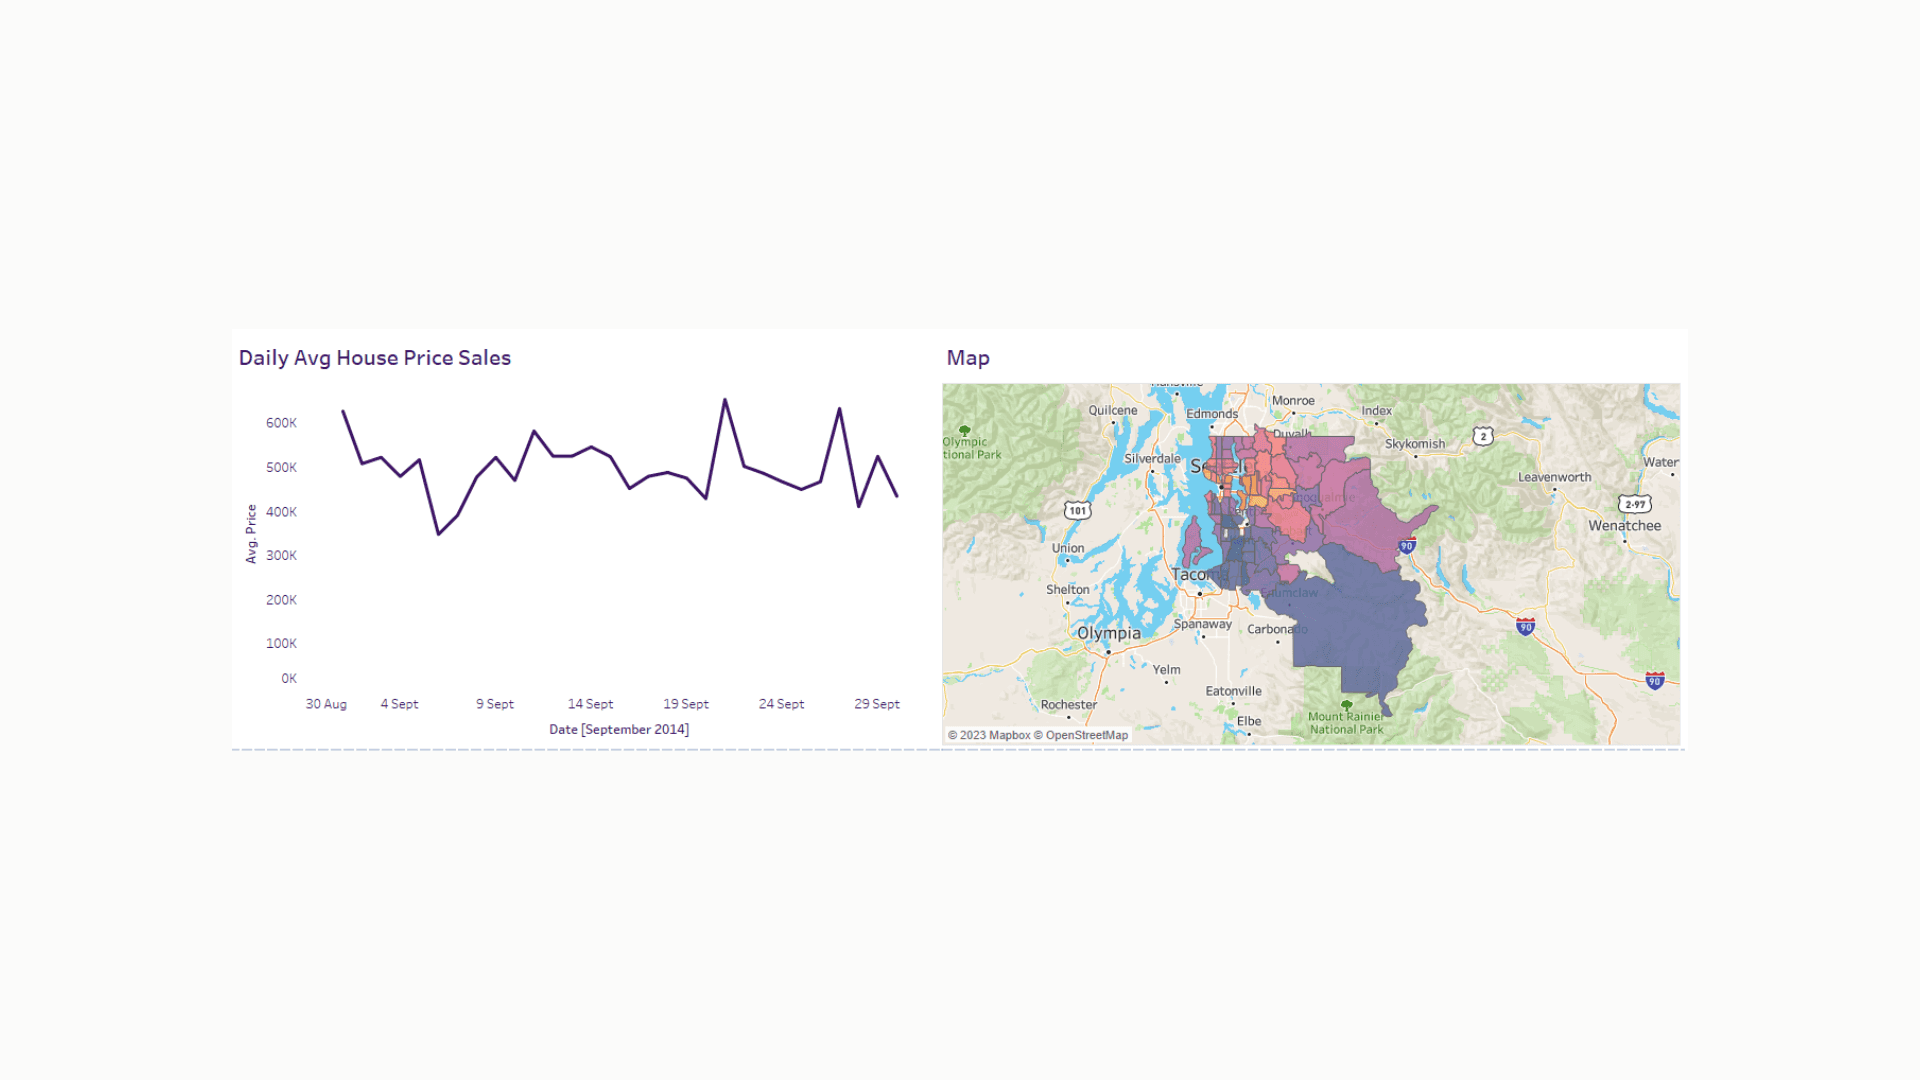
The outcome of this research culminated in a visually compelling and user-friendly Tableau dashboard that effectively conveyed house sales insights. By incorporating dynamic elements such as line charts, histograms, and a heatmap on a geographical map, coupled with interactive filters like calendars and sliders, the dashboard allowed users to explore and understand house sales trends with ease.